Open Biology · 2nd edition
Page 142Free open textbook · CC-BY 4.0
Biology — Cell & Energy·Chapter 6
Photosynthesis
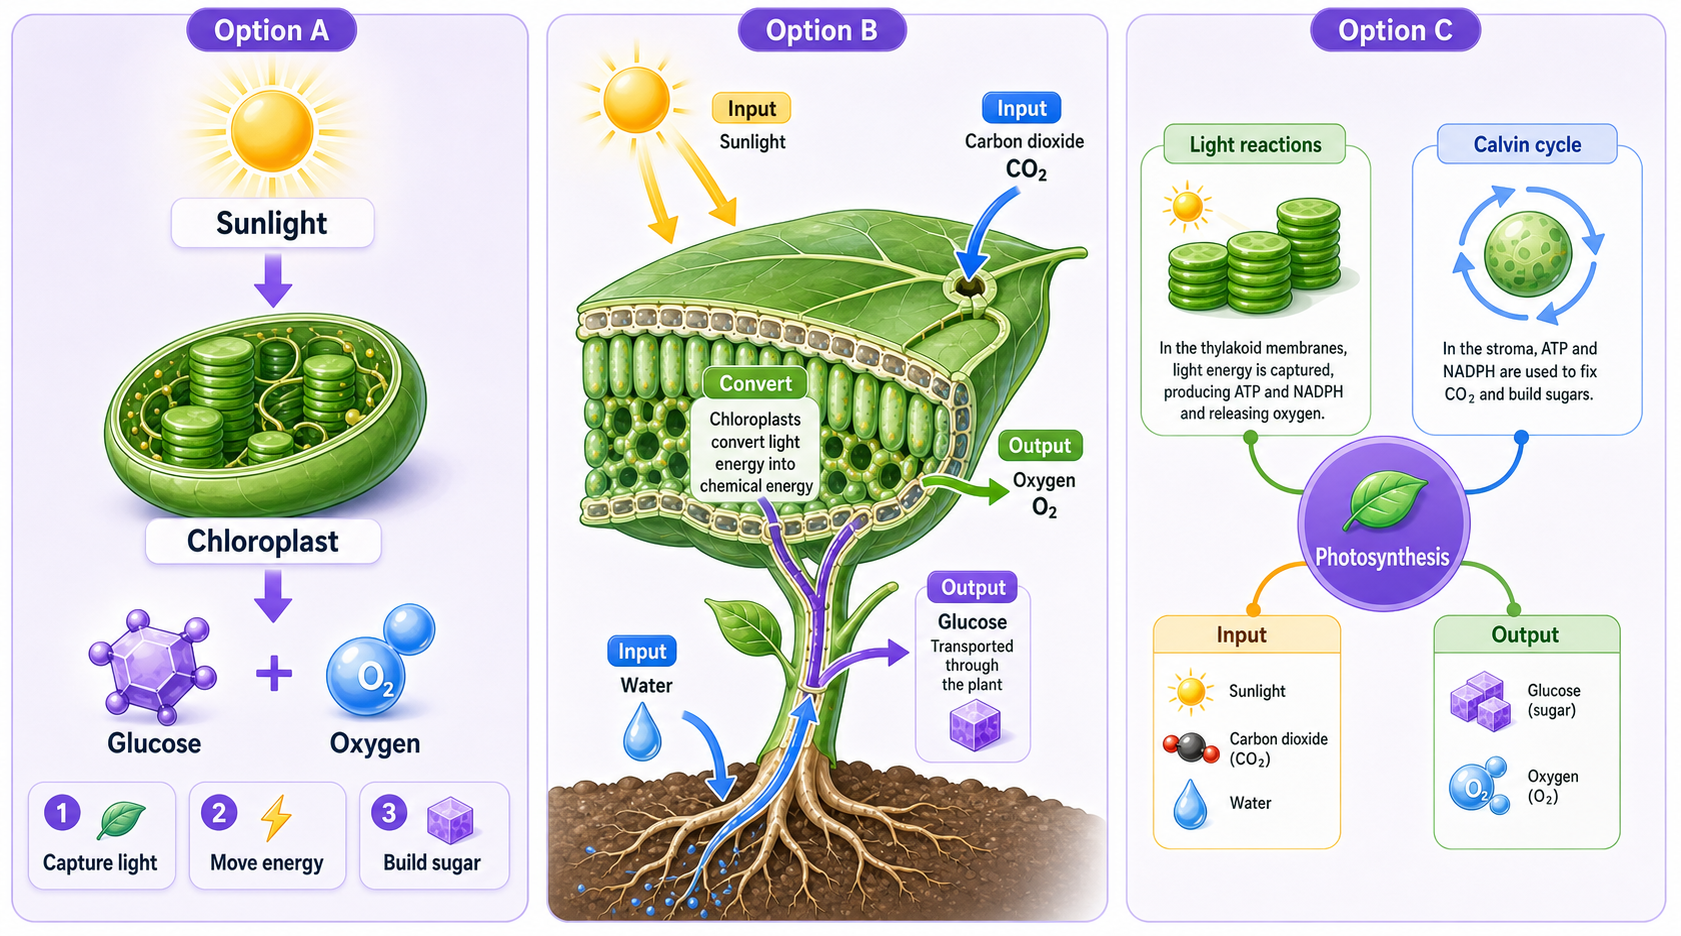
Photosynthesis is the biochemical process by which green plants, algae, and certain bacteria convert light energy — typically from the Sun — into chemical energy stored in glucose. The process takes place primarily in the chloroplasts of plant cells and is summarized by the equation:
Two stages
Photosynthesis proceeds in two coupled stages. The light-dependent reactions occur in the , capturing photons to split water, generate ATP, and reduce NADP⁺ to . The light-independent reactions, also known as the , take place in the stroma and use ATP and to fix carbon dioxide into three-carbon sugars that are eventually assembled into glucose.
Variations
Most plants use the C3 pathway, but in hot, dry climates many species have evolved or pathways to minimize water loss and reduce photorespiration. These adaptations are critical to crops such as maize, sugarcane, and pineapple.
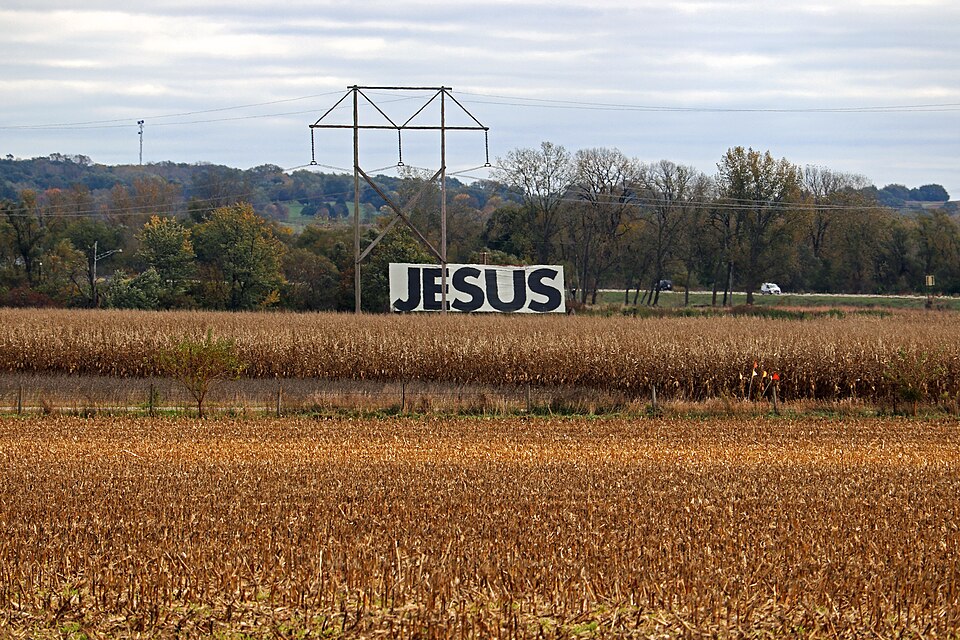
C4 · Maize
Concentrates CO₂ in bundle-sheath cells
Iowa cornfield · CC BY-SA
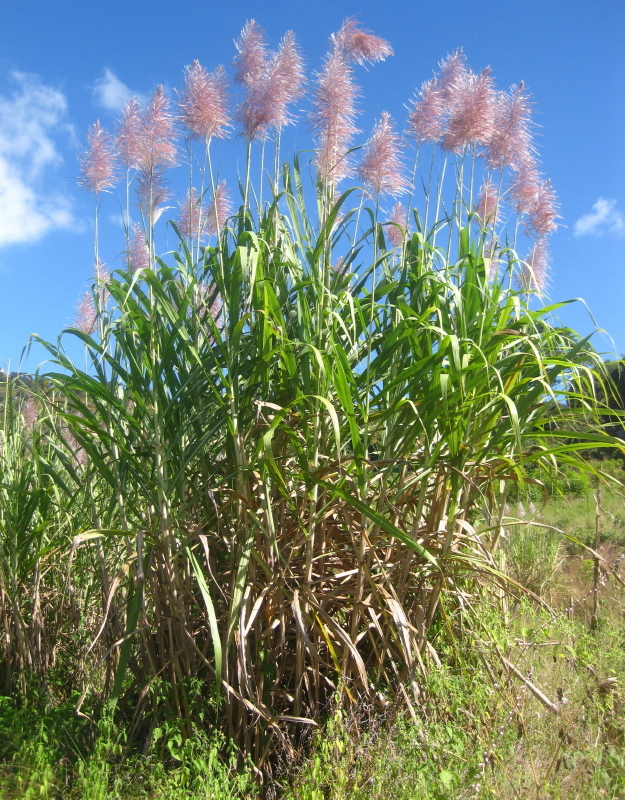
C4 · Sugarcane
Highly efficient in hot, sunny climates
Saccharum officinarum · CC BY-SA
CAM · Pineapple
Opens stomata at night to save water
Pineapple plantation, Azores · CC BY-SA